👋

Hello! I’m Ganesh

I’m a Senior Software Engineer, Data Engineer, Power BI PL-300 Certified Specialist.

Production-grade Power BI dashboards
End-to-end data pipeline architecture
75% performance improvements delivered
Hello
Ganesh Doifode
SCROLL
POWER BIDATA ENGINEERINGETL PIPELINESDAX & MODELINGAZUREPYTHONDASHBOARDS

Learn about myself
& what I do

0.5+
Years Experience
0+
Dashboards Built
0+
Workflows Migrated
0%
Performance Gains

I’m a Senior Software Engineer with deep expertise in data engineering and business intelligence. Currently at malomatia, I architect end-to-end data solutions that transform raw data into strategic business insights.

My journey spans healthcare, enterprise finance, and IT asset management — building Power BI dashboards that drive real business outcomes: 15% cost reductions, 75% performance improvements, and $60K+ annual savings.

I don’t just build reports — I engineer complete data ecosystems with optimized ETL pipelines, star schema models, and DAX measures that deliver sub-5-second load times.

Quick Info

Location
Pune, Maharashtra, India
Company
malomatia
Certification
Power BI PL-300
Badge
Oracle Cloud | ACC-SCD

Tools & Technologies
I Work With

BI & Visualization

Building interactive Power BI dashboards with DAX, data modeling, and visual storytelling.

Data Engineering

Designing ETL pipelines with SSIS, Alteryx, Azure Data Factory, and Snowflake.

Cloud & Automation

Automating workflows on Azure, Power Automate, Microsoft Fabric, and Oracle Cloud.

Programming

Writing Python, T-SQL, PL-SQL scripts and integrating REST APIs with Gen AI tools.

Where I've Worked

3.5+ years of progressive experience across healthcare, finance, and enterprise IT — building data solutions that deliver measurable impact.

01

Senior Software Engineer

CURRENT

malomatia · Pune, India

Aug 2025 - Present
Architecting enterprise data solutions and BI platforms
Leading Power BI dashboard development for strategic decision-making
Building end-to-end ETL pipelines on Azure cloud infrastructure
Power BIAzurePythonSQL Server
02

Software Engineer

Stridely Solutions · Pune, India

Apr 2024 - Aug 2025
Built Profit Cube dashboard saving 15% in material costs
Migrated 200+ Alteryx workflows to SQL, saving $60K/year
Developed FP&A executive suite with 40+ backend pages
Power BIDAXAlteryxMS-SQL
03

Software Engineer

Hartford HealthCare · Pune, India

Jan 2022 - Mar 2024
Built healthcare analytics on Azure Data Factory with 8+ data sources
Designed star schema models for emergency service insights
Achieved 25% faster report loading via DAX optimization
Azure Data FactoryPower BIStar SchemaPower Automate

Interactive Reports

14 live Power BI reports across data visualization challenges, analytics competitions, and real-world case studies.

1 of 8 reports
Workout 001 – Ratings AnalysisBar Chart & Table
LIVE

Deep Dive: Project Case Study

A detailed walkthrough of a real enterprise project - from problem to architecture to production deployment.

CASE STUDYIN PRODUCTION

Marketing BI Multi-Source Data Platform

End-to-end ETL pipeline integrating 6 data sources into a unified Power BI dashboard for cross-channel marketing analytics at Malomatia.

The Problem

The marketing team at Malomatia was pulling data manually from Facebook, Instagram, GA4, LinkedIn, X (Twitter) and Simpplr Hub every week. Lots of copy-paste, reports were always a week behind, and there was no single source of truth for cross-channel performance.

The Solution

I designed and built the entire pipeline so that all 6 sources flow into Oracle automatically every day, and Power BI picks it up for self-service analytics. Every Python script follows a modular pattern with shared configuration, supports multiple run modes, and logs every execution to a central monitoring table. All jobs are scheduled via Windows Task Scheduler using .bat wrapper files with staggered timings on an internal VM.

6
Data Sources
27
Daily Script Runs
Daily
Refresh Cycle
100%
KPI Match

Tech Stack

LanguagesPython 3.10+, SQL (Oracle PL/SQL), DAX, M (Power Query)
DatabaseOracle 19c - staging tables, reporting tables, stored procedures
APIsFacebook Graph, Instagram Graph, GA4 Data API, LinkedIn Marketing API, X/Twitter API
Python Libsoracledb, pandas, requests, paramiko, python-dotenv
BI LayerPower BI Desktop (PBIP), Power BI Service, Deneb/Vega-Lite
AutomationWindows Task Scheduler + .bat wrapper files on internal VM
MonitoringOracle MKT_JOB_EXECUTION_LOG + SMTP email notifier

Architecture

The pipeline follows a 5-stage architecture: Data Sources → Extract (Python REST API scripts) → Transform (Oracle staging tables + stored procedures) → Load (Power BI Desktop for report creation) → Service (Power BI Service publishes reports to business users). Each stage has its own monitoring and error handling built in.
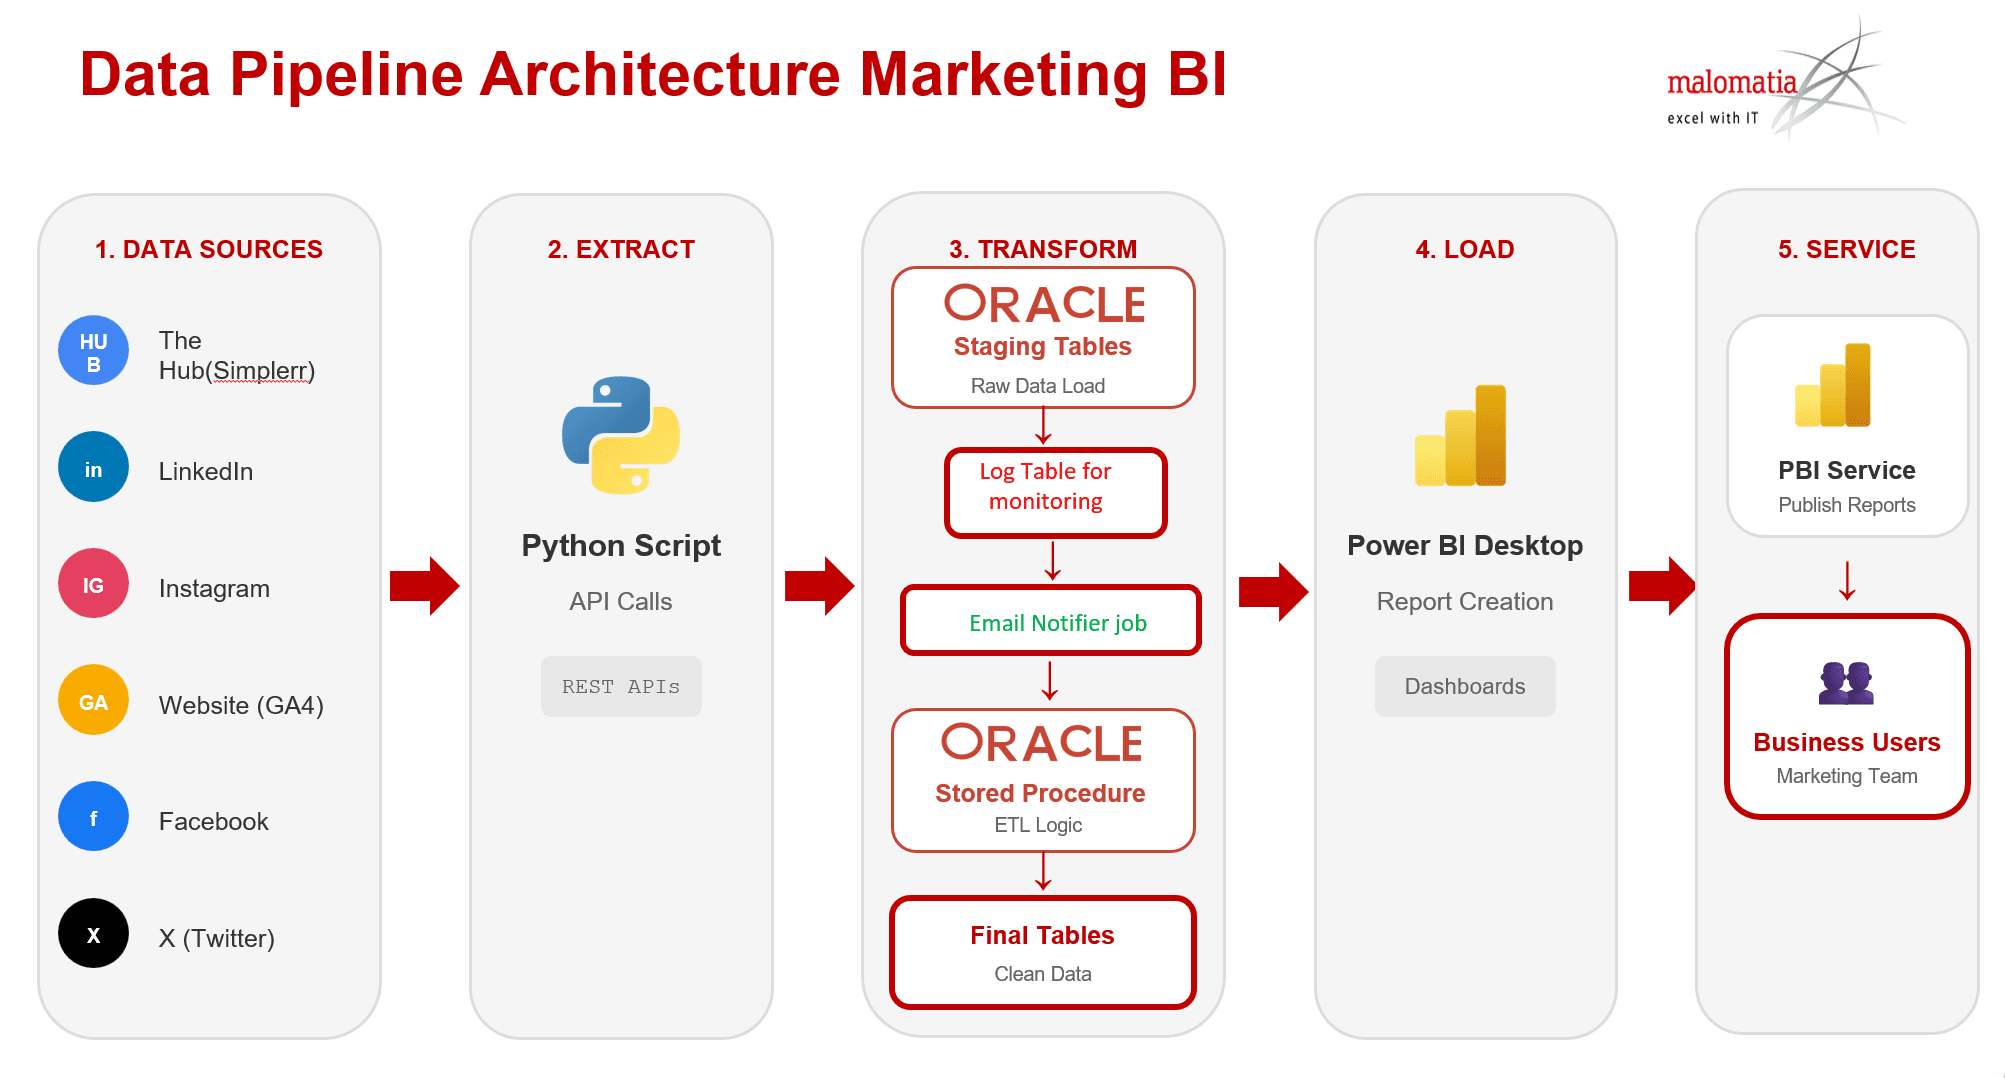
Marketing BI Data Pipeline Architecture

Data Pipeline Architecture - Marketing BI Platform at Malomatia

Meta Integration (Facebook + Instagram)

Facebook and Instagram data flows through the Meta Graph API. I built separate Python scripts for page-level metrics (reach, impressions, engagement) and post-level performance. Each script connects to Oracle using the oracledb library, loads data into staging tables first, then Oracle stored procedures transform and push to final reporting tables. Scripts support full and incremental modes with DELETE+INSERT logic for daily data and MERGE for post-level metrics. Long-lived access tokens are configured so the pipeline runs unattended without breaking every 60 days. All scripts are scheduled via .bat wrapper files on the internal VM with job execution logging to MKT_JOB_EXECUTION_LOG.

How it works:

Separate scripts for page metrics, post metrics, and audience demographics
DELETE+INSERT for daily metrics, MERGE upsert for post-level data
Long-lived access tokens configured for unattended daily runs
Page Reach validated against Oracle and API with exact match verification
Visual-level filters in Power BI to handle Meta lifetime-only post metrics
Scheduled via .bat files with staggered timings and centralized job logging

LinkedIn Page Analytics Integration

LinkedIn was one of the hardest integrations to get off the ground. Getting Development Tier API access itself took weeks of coordination with the LinkedIn API team because their Community Management API has a strict vetting process before they even let you make your first API call. Once access was granted, I built modular Python scripts using the requests library with OAuth 2.0 authentication. Each script supports three run modes: full load (truncate + reload), incremental (Oracle MERGE upsert), and date-specific backfill. The codebase follows a shared config pattern with a common config.py and loader_helpers.py so that any future developer can add a new endpoint without touching existing scripts. All jobs are scheduled via Windows Task Scheduler using .bat wrapper files with staggered timings to avoid database contention.

How it works:

Full OAuth 2.0 flow with token refresh and Session-based URL encoding fix
8 Oracle tables covering followers, posts, engagement, page views, and demographics
Three run modes per script - full, incremental (MERGE upsert), and date-specific backfill
Shared config.py + loader_helpers.py pattern for maintainable, scalable codebase
Rate-limited image fetcher with retry logic for Development Tier API limits
Scheduled via .bat files on Windows Task Scheduler with staggered job timings

Google Analytics 4 Integration

GA4 integration uses the official google-analytics-data Python library to pull data from the GA4 Data API. The tricky part was handling non-SUM-safe metrics - unique-count metrics like Active Users, Sessions, and Bounce Rate get inflated when you sum them across dates because the same user gets counted multiple times. I had to work around this carefully because the marketing manager was matching every single KPI against the GA4 UI. Each script follows the same modular pattern with DELETE+INSERT logic, date dimension handling, and centralized job logging. Scripts are scheduled via .bat files with staggered timings on the internal VM.

The gotcha:

Views, Event Count, New Users are SUM-safe. But Active Users, Sessions, Bounce Rate are NOT - summing them across dates gives inflated numbers. Built separate summary tables without a date dimension to get exact GA4 UI match.

How it works:

5 dedicated scripts - device stats, top pages, active users by geo, period metrics, summary table
Separate GA4_TOP_PAGES_SUMMARY table (no date dimension) for accurate bounce rate matching GA4 UI
Many-to-Many relationship in Power BI on PAGE_TITLE linking daily and summary tables
Rolling period logic (Last 7/30/90 days) built in DAX with proper partial period handling
DELETE+INSERT load pattern with date dimension for daily metrics
Scheduled via .bat files with centralized MKT_JOB_EXECUTION_LOG monitoring

Simpplr Hub Analytics Pipeline

Simpplr is the internal employee intranet platform at Malomatia. Unlike the other sources which use REST APIs, Simpplr pushes daily gzipped CSV exports to an AWS SFTP folder. I built a modular pipeline using Python with the paramiko library for SFTP connectivity and pandas for data transformation. Each entity (users, content, sites, interactions, login events, newsletters) has its own dedicated script that downloads the latest CSV, decompresses it, transforms the data, and loads it into Oracle.

How it works:

Modular per-entity scripts - load_user.py, load_content.py, load_site.py, load_interaction.py, load_login_events.py, load_newsletter.py
Three run modes per script - full (truncate + reload), incremental (Oracle MERGE), date-specific backfill
SFTP pull using paramiko library with gzip decompression
Proper schema design done upfront after max-length analysis on complete dataset
Power BI Incremental Refresh on high-volume tables using derived REFRESH_DATE column
Pipeline runs every morning at 06:30-06:50 Qatar time before office hours via .bat scheduler

Custom Deneb Visuals

After the base platform was live, leadership wanted richer storytelling visuals. Standard Power BI charts were not giving the look the marketing head wanted, so I built custom visuals using Deneb / Vega-Lite directly inside Power BI. These visuals are powered by Oracle views (MKT_VW_CHANNEL_DAILY_METRICS and MKT_VW_CHANNEL_MONTHLY_SUMMARY) that aggregate data across all channels.

Channel Heartbeat

Stacked ridgeline chart showing each channel engagement waveform over time. Built with Deneb/Vega-Lite, reveals engagement patterns that standard bar charts completely miss.

Weekday Heatmap

Day-of-week and hour-of-day engagement matrix per channel. Tells the team exactly when to post for maximum reach. Uses Malomatia Sunday-Thursday work week.

What This Brings to the Table

This is not just a reporting tool - it changes how the marketing team operates on a daily basis. Here is the real business value this platform delivers:

Single Source of Truth

No more pulling data from 6 different platforms. One dashboard, one version of the truth. The marketing head walks into a Monday meeting with numbers everyone trusts.

Weekly to Daily Decisions

The team used to react to last week data. Now they see yesterday performance first thing in the morning. A bad campaign gets caught on Day 2, not Day 8.

Zero Manual Work

No more copy-pasting from Meta Business Suite, GA4 dashboard, or LinkedIn Analytics. The entire data collection pipeline is fully automated and monitored.

Trust in Numbers

Every KPI is verified 1:1 against the source platform UI. The team does not second-guess the dashboard - they act on it. This took careful handling of GA4 non-SUM-safe metrics and Meta lifetime-only limitations.

Cross-Channel Insights

For the first time, the team can compare LinkedIn engagement against Instagram reach against GA4 website traffic in one view. They spot which channel is driving real results.

Scalable and Maintainable

Adding a new data source means writing one new Python script and one Oracle table - the rest of the framework (logging, monitoring, email alerts, Power BI model) already handles it. Shared config pattern means any developer can extend the codebase.

Outcome

The marketing team now opens one Power BI report and gets a unified view of all their channels. No more manual data pulls, no more week-old numbers. All KPIs are verified one-to-one against the source UIs so they have full trust in the numbers.

Impact Summary
Data latency reduced from weekly to daily refresh
6 channels unified into one cross-channel dashboard
27 Python scripts executing daily with full/incremental modes
Every KPI verified 1:1 against source platform UIs
37+ automated jobs monitored via consolidated email alerts
Marketing team makes daily decisions instead of weekly reviews
Zero manual data collection - fully automated end-to-end
Shared codebase pattern enables easy onboarding and future extensions

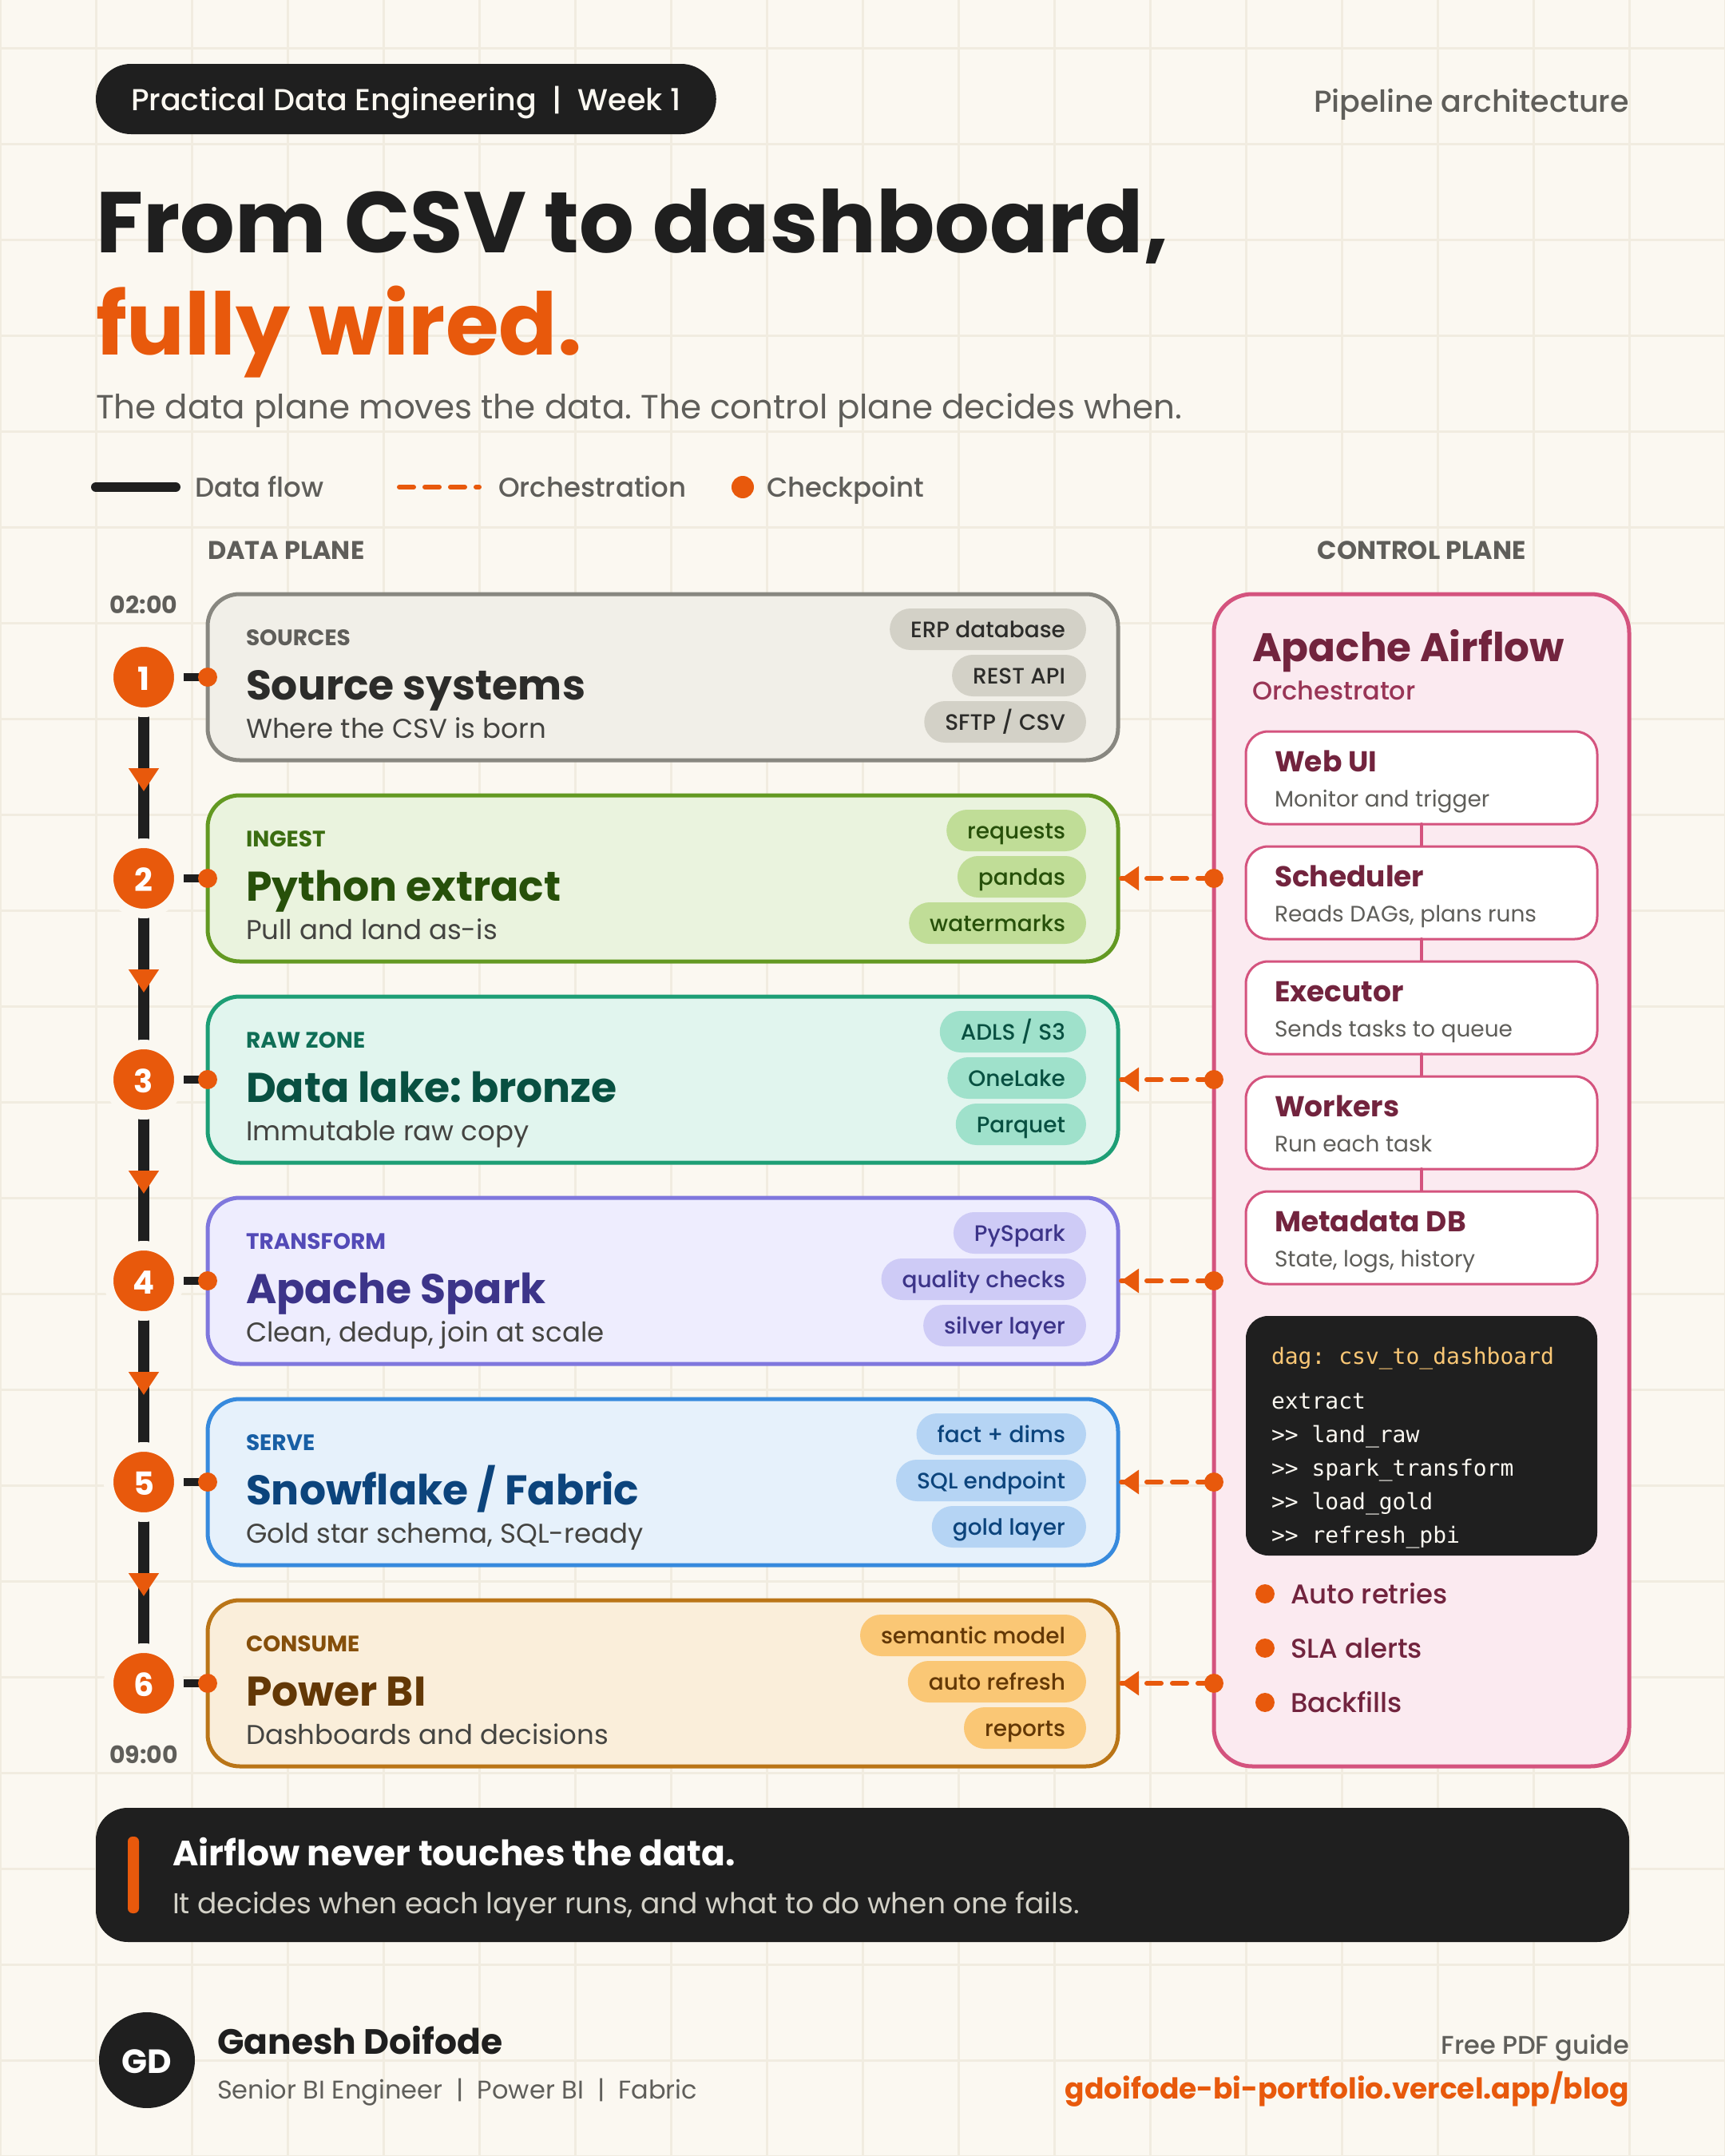
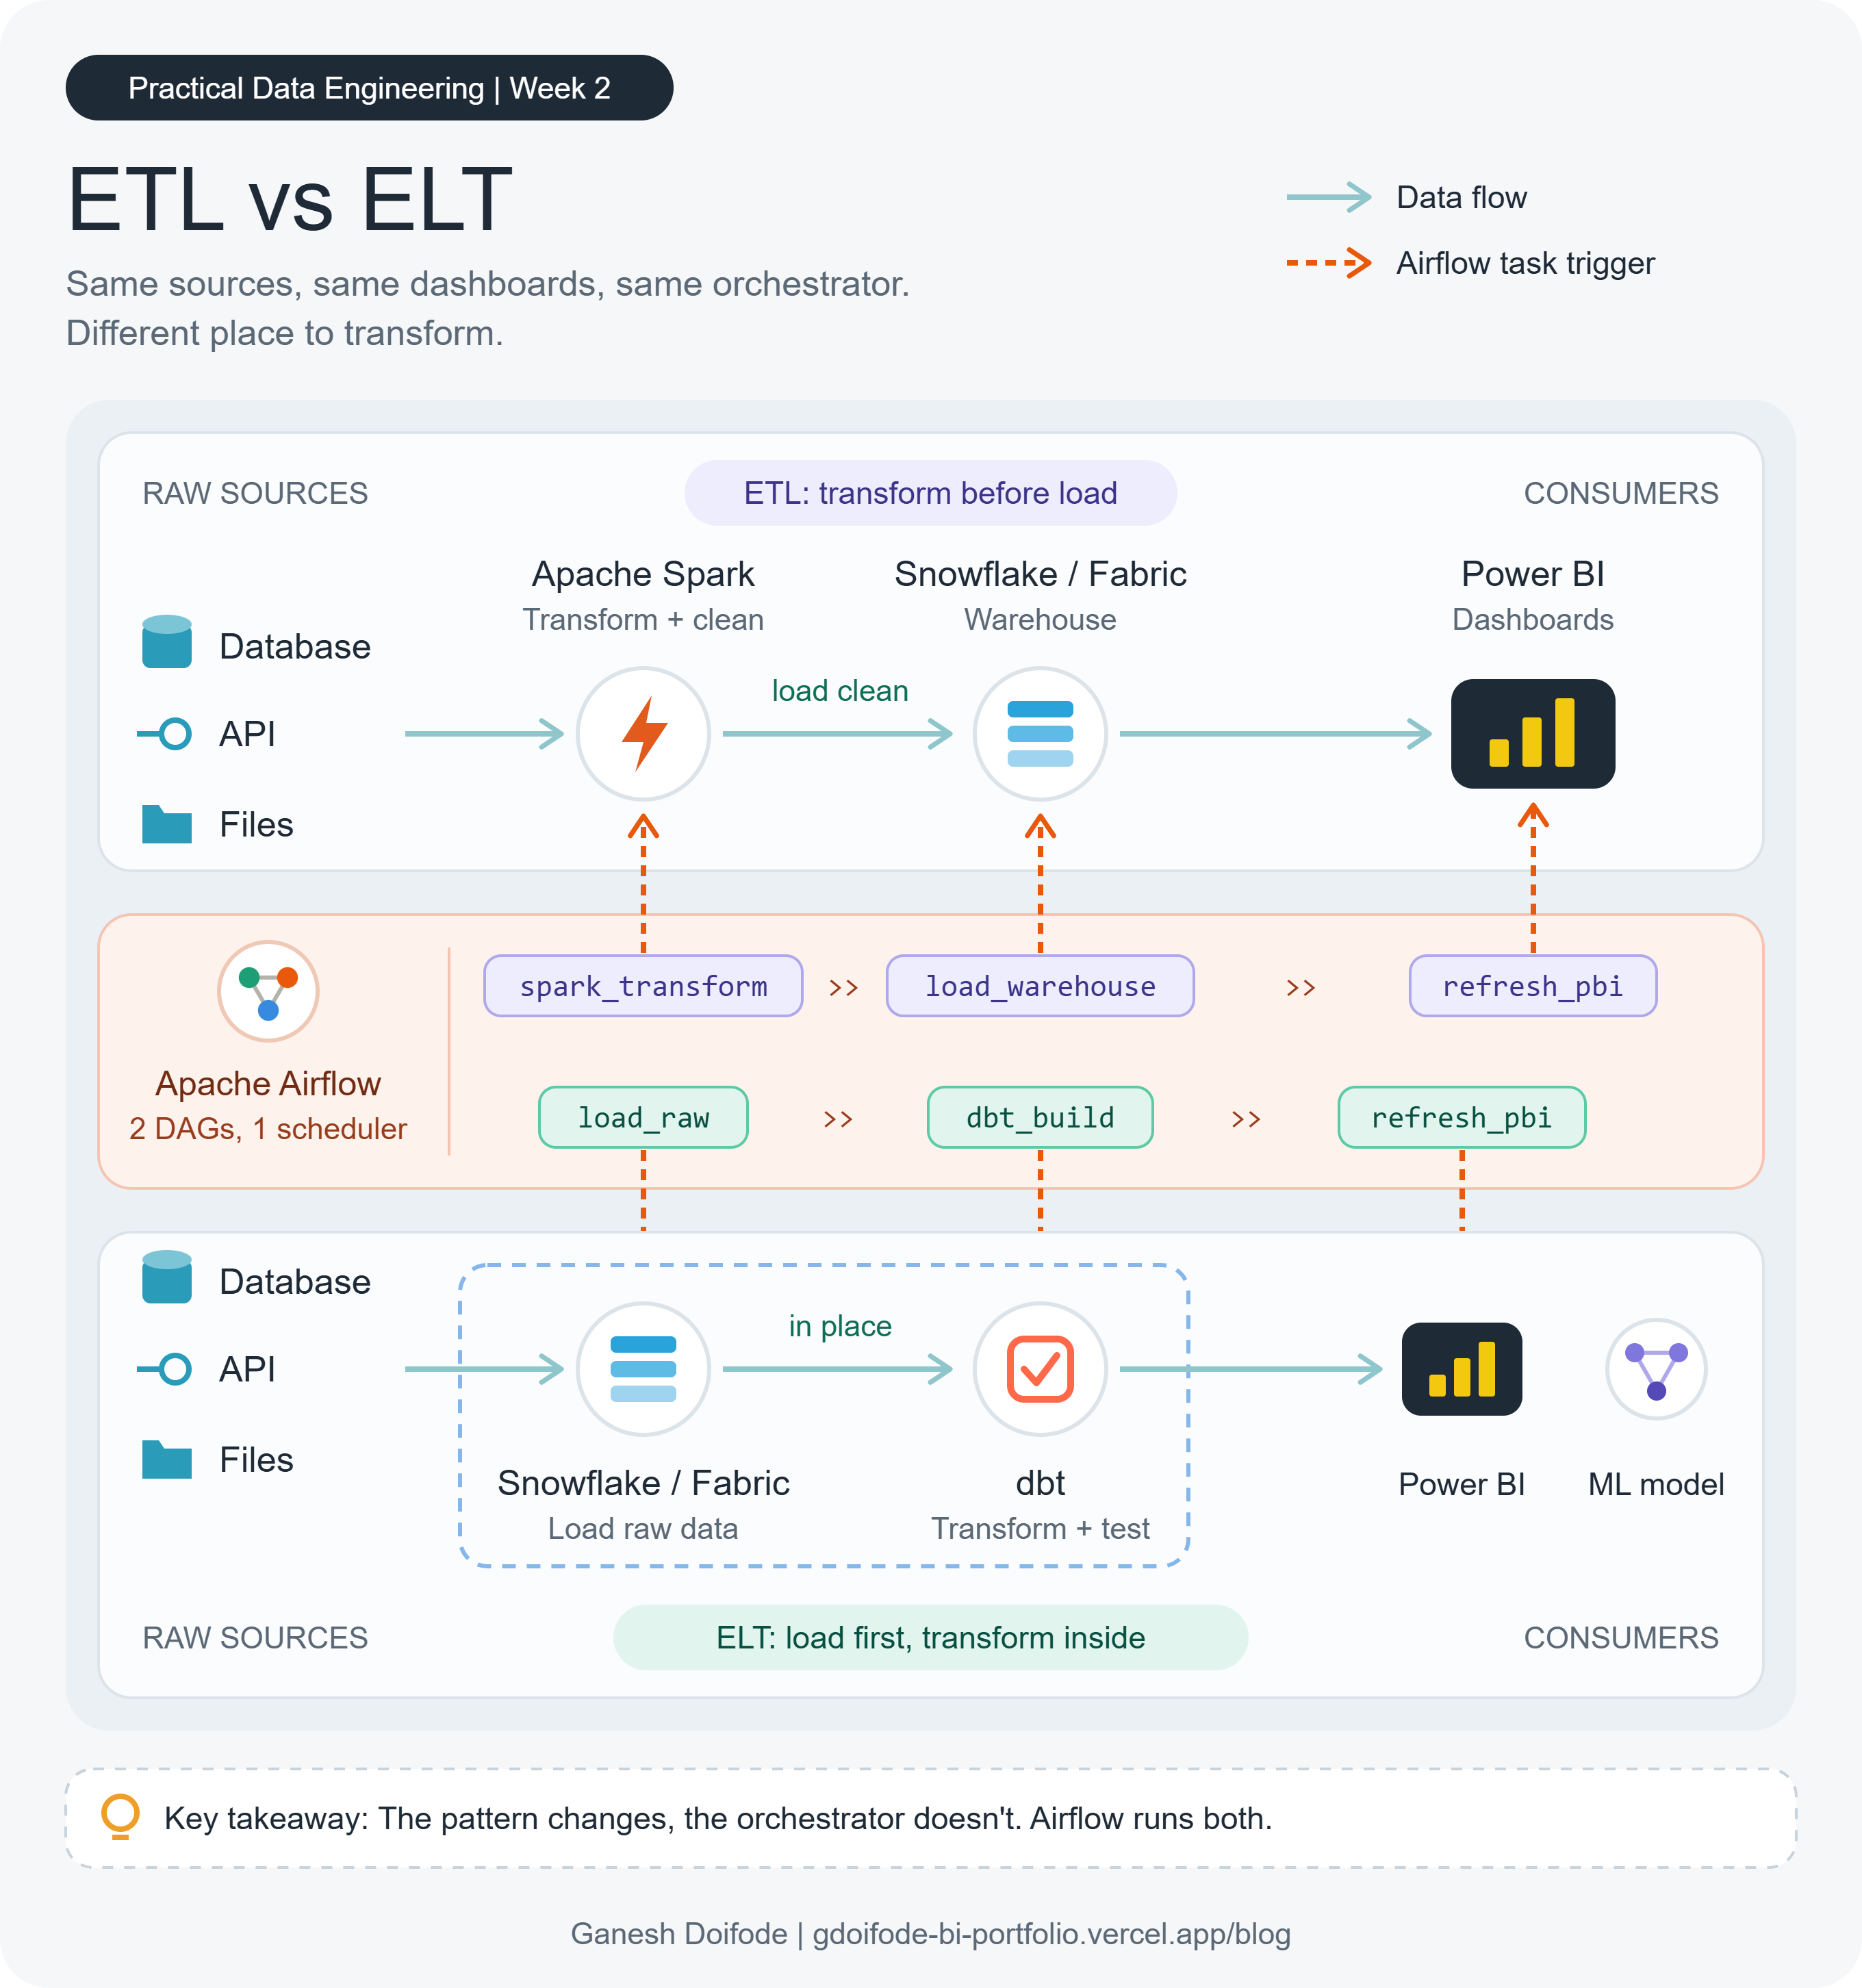
Weekly Guides

How modern data tools work together to build reliable, scalable data platforms.

View all guides →

Let’s Get
in touch

Have a project in mind? Don’t hesitate to reach out. I’d love to hear about it.

Send a Message

What’s in your mind?

I’ll get back to you within 24 hours